

Portfolio Overview
Your whole portfolio, quantified.
A dashboard of deep data on your whole portfolio — opportunity, rollover, and value across every building — that your team can configure for whatever view it needs.
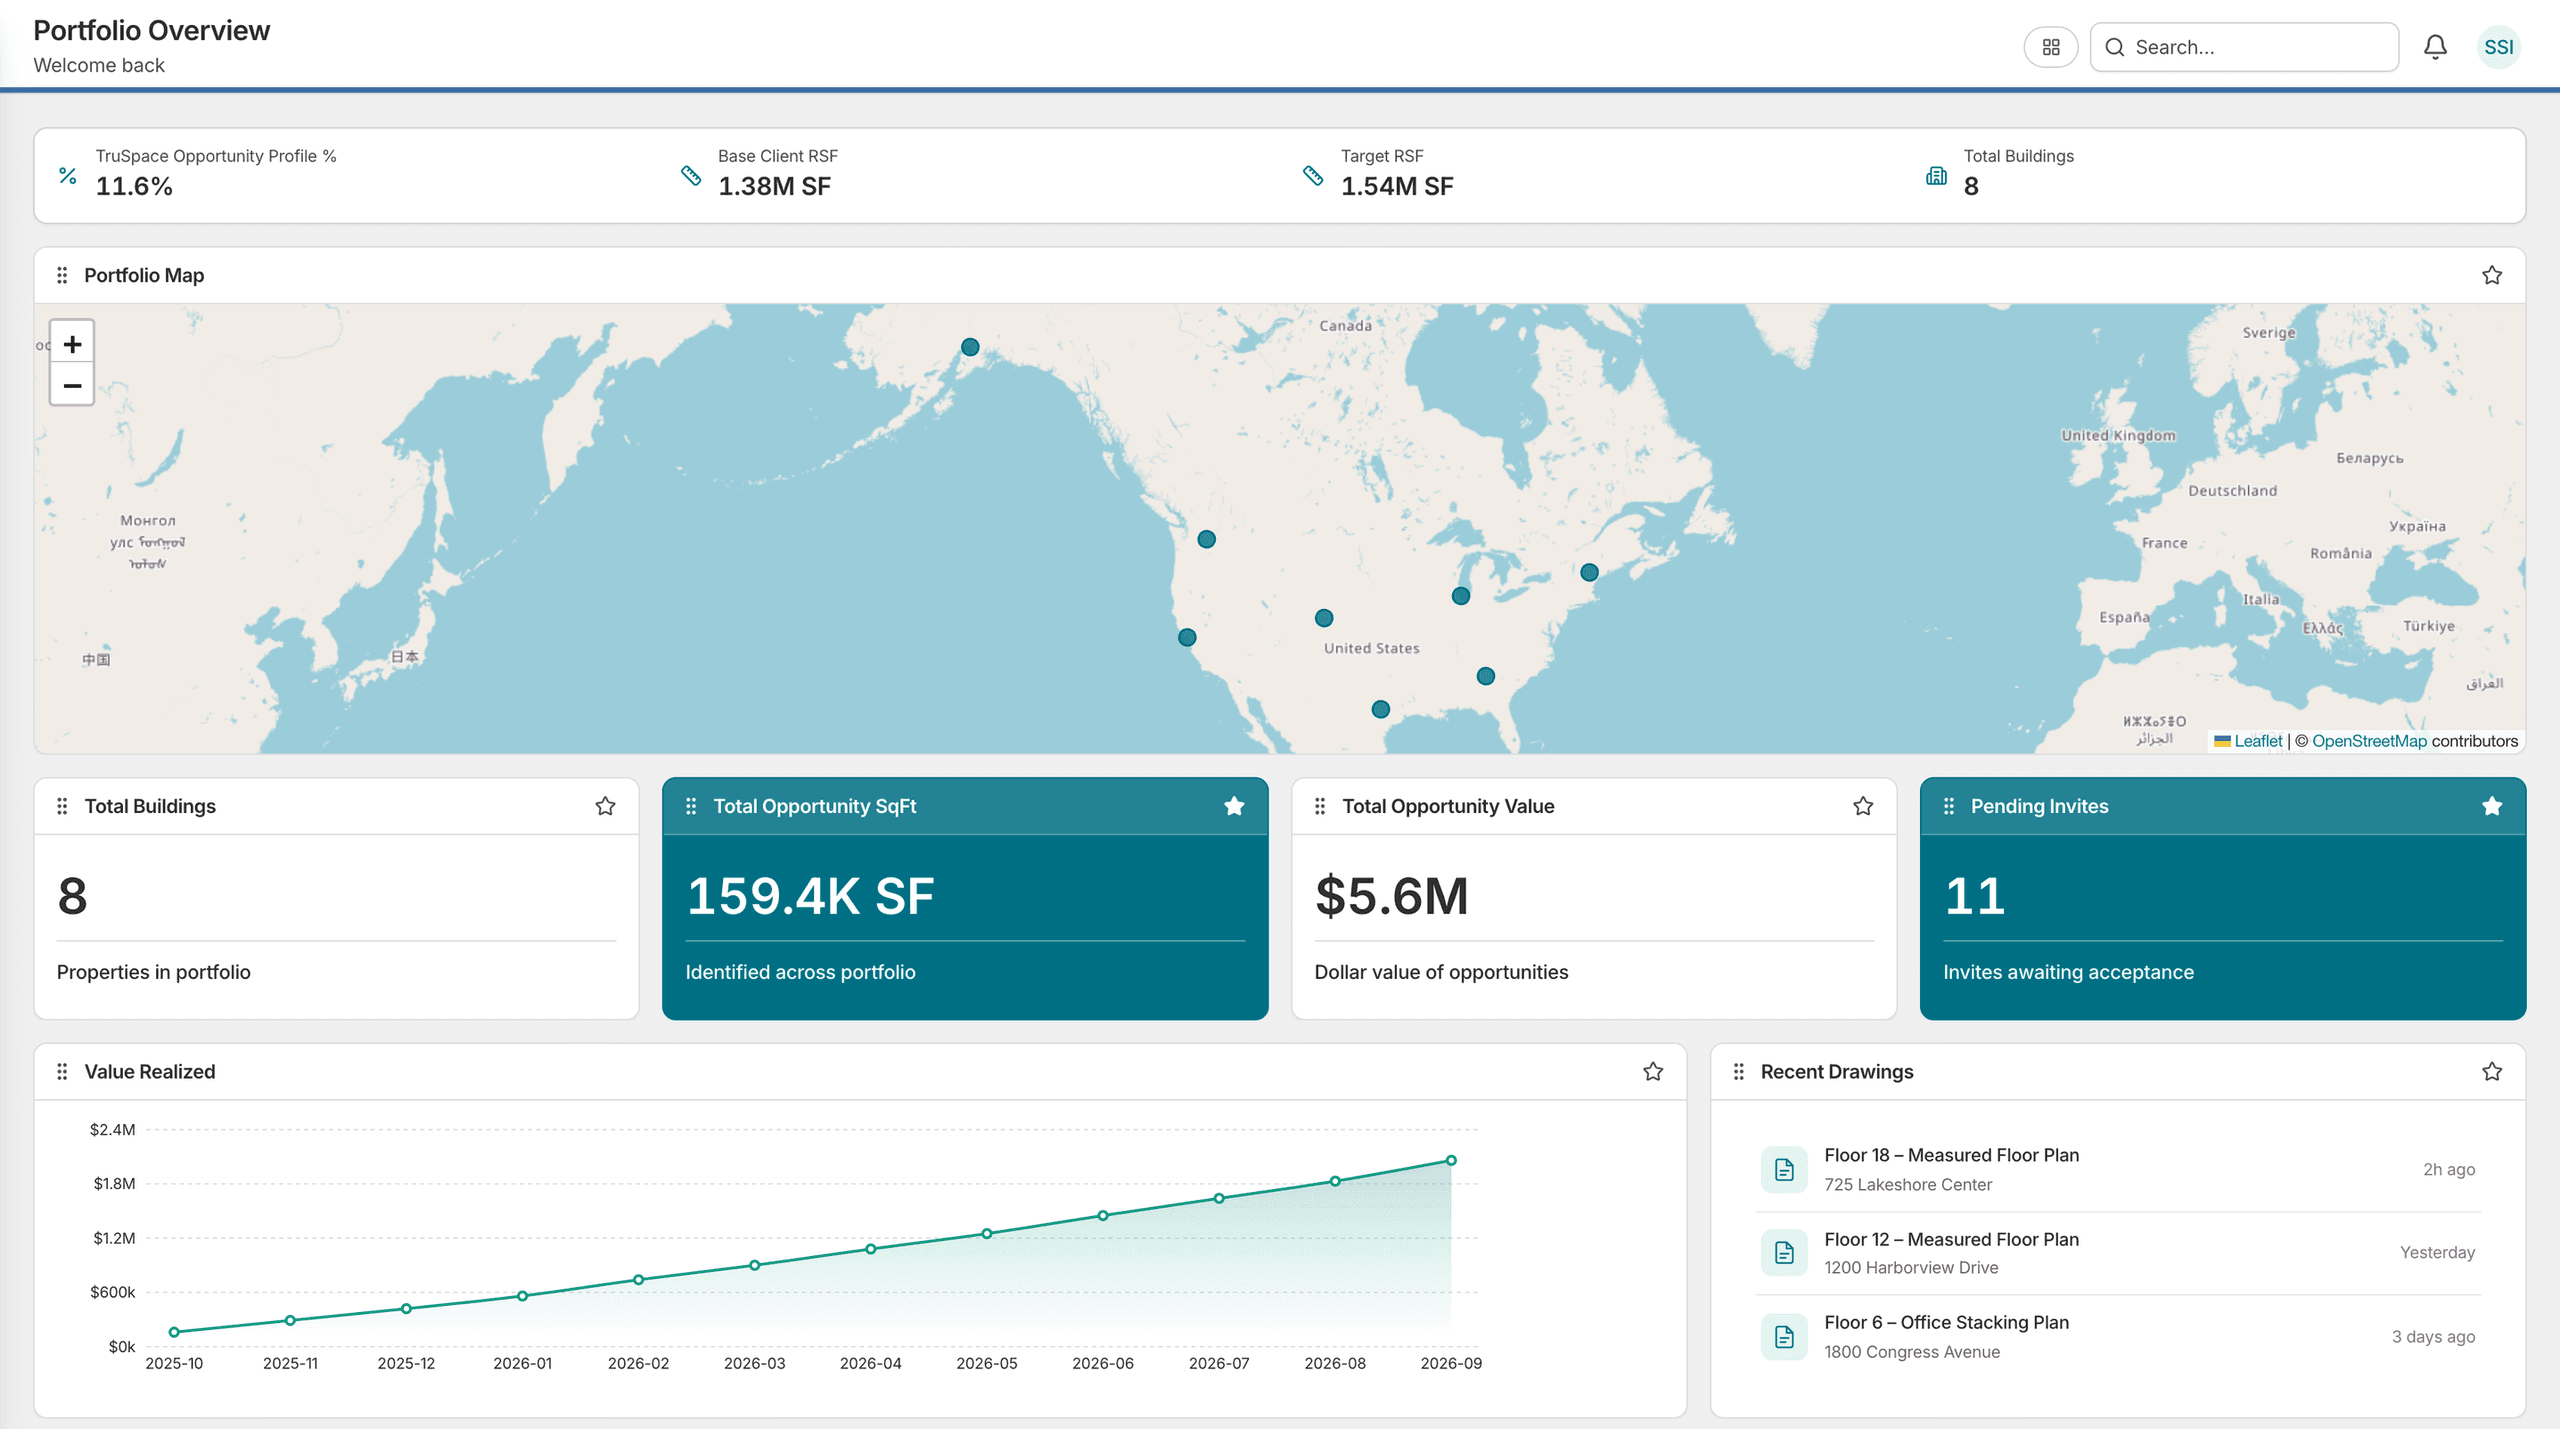

A dashboard for everything.
Star the widgets that matter and arrange them however your team reads best, from a quick portfolio check-in to a deep dive — and every number on the dashboard traces back to a measurement.
Built for the people who answer for the portfolio.
The C-Suite
Portfolio performance at a glance, on one screen, with every figure traceable back to a measurement.
Asset Managers
Where the opportunity sits, by building and across the book, in square feet before it is in dollars.
Portfolio Managers
Rollover exposure across the whole portfolio, far enough out to act on rather than react to.

See your portfolio quantified.
Schedule a walkthrough and we'll show you the opportunity in your own portfolio, modeled against your own rate assumptions.